51
This GNLP needs to plan for additional housing needs above and beyond existing commitments based on evidence. It also needs to plan for changes in the types of homes we need. Several factors are driving this increase in the need for more and different types of housing including rising population levels, an increase in the number of older people, more younger people sharing homes and a limited supply of housing over much of the last decade.
52
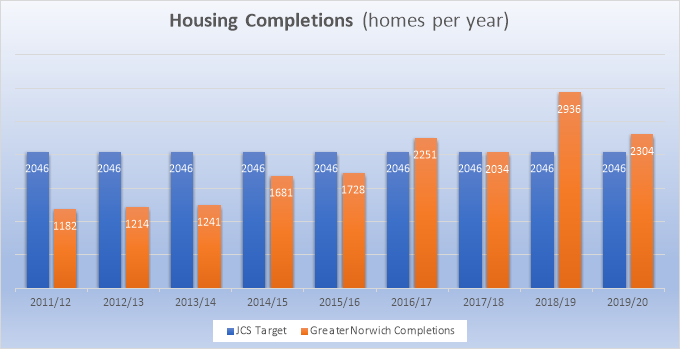
Between adoption of the Joint Core Strategy (JCS) in 2011 and 2020, 90% of the housing target has been delivered. Whilst housing completions were well below target in the early years of the JCS plan period, there was a generally a steady annual increase in completions, and delivery was around and above the JCS annual target in the most recent years (see the housing completions graph below).
53
In both 2018/19 and 2019/20 Greater Norwich had a five-year housing supply, including the 5% buffer required by the NPPF.
54
Part of the reason for the increase in housing delivery in 2018/19 is that changes in Government policy have allowed new purpose-built student accommodation delivery to be included in the housing figures at a rate of 1 home per 2.5 student bedrooms. Between 2018 and 2020 over 1,000 new student bedrooms were delivered, the equivalent of around 400 new homes19. This reflects a growing trend in recent years for new student accommodation development, particularly at the University of East Anglia (UEA) and in the city centre. If, as currently planned, the UEA and the Norwich University of the Arts (NUA) expand further and some students continue to seek better quality accommodation, this trend could continue to 2038. While it is too early to judge the long-term impacts of Covid-19, there is currently no evidence that ongoing provision of student accommodation will slow over the plan period. Care Home bed spaces can also now be counted against housing need at a suitable discounted rate.
56
Broadland and South Norfolk are dominated by owner occupied housing, whilst Norwich has a much higher percentage of social rented and private rented properties (see table 2 below)20. The figures for owner occupation compare to a national figure of 63%. The area’s tenure mix has changed since 2001, with falls in home ownership and social renting and corresponding rises in the percentage of private rented properties across all three districts, mirroring the national picture. This trend seems likely to continue.
Table 2: Tenure mix of housing in Greater Norwich districts in 2018:
Owner occupied |
Private rented |
Social rented |
|
Broadland |
79% |
12% |
9% |
Norwich |
39% |
30% |
31% |
South Norfolk |
76% |
12% |
12% |
57
In 2018, the property price to earnings ratio was 9.2 in Broadland, 7 in Norwich and 8.8 in South Norfolk, compared to a national average of 7.821. Affordability is a major barrier to home ownership locally.
58
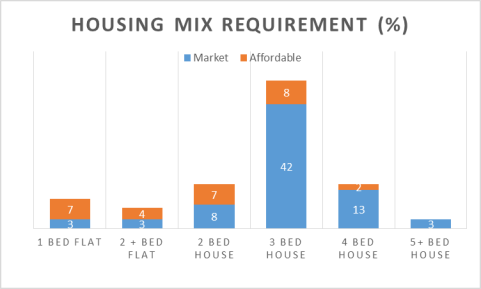
Local evidence22 identifies that 28% of the housing required from 2015 to 2038 should be affordable housing. It also shows that the mix of housing tenures required differs by the type of home as illustrated in the graph below. The highest requirement for general market housing is for three bed homes. Affordable housing needs can be different. The most up to date breakdown of affordable housing need across the three districts will be used by the individual local authorities when planning applications are being considered.
59
This plan seeks to address this by developing the required number, tenures and types of homes to meet this demand. The mix of requirements will change through the plan period as different needs are met by development.
60
Owing to the projected increase in the numbers of older people, local evidence in the Strategic Housing Market Assessment suggests that around 3,900 additional communal establishment places for over 75s will be required to 2038. The plan will need to have policies which specifically support the delivery of housing suitable for older people and support active retirement.
61
The provision of sites for Gypsies and Travellers consisted of 84 pitches in 2017. These are on large sites at Swanton Road (Norwich), Roundwell (Costessey) and Harford Bridge (Keswick), and on several small sites around the area. There are 55 plots for travelling show people at Hooper Lane in Norwich. There will be a need for some additional accommodation during the plan period.
62
There are some wards and more localised areas with high levels of deprivation in Norwich23. Although the surburban and rural parts of Greater Norwich are relatively affluent, there are pockets of deprivation elsewhere too. It is important that inclusive growth and regeneration is supported through the GNLP to help to reduce deprivation.
Footnotes
19Source: Data from Greater Norwich Annual Monitoring Reports
20Source: Office for National Statistics
21Source: Office for National Statistics
22ORS Central Norfolk Strategic Housing Market Assessment (SHMA) 2017