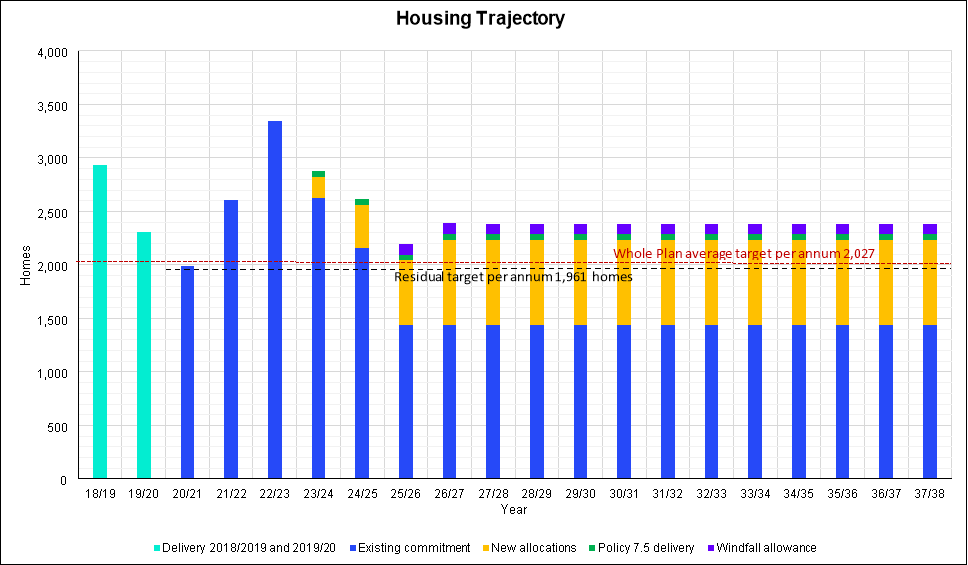
The purpose of the trajectory
As required by NPPF paragraph 73, the housing delivery trajectory below sets out the potential rate of housing delivery in Greater Norwich during the plan period from 2018 to 2038. Using the number of homes shown in table 6 of this plan, the total housing figure of 49,492 includes a 22% buffer on the local housing need figure. It is important to note that the figure of 49,492 is potential housing delivery during the plan period, not the housing need. As stated in table 6, the need is 40,541. The latter will be used to calculate 5-year housing land supply.
Overall housing delivery 2018 to 2038
Reflecting table 6 of this plan, the components of the housing trajectory for the 49,492 homes are:
- housing completions during the first two years of the plan, 2018/9 and 2019/20 (5,240 homes);
- the existing commitment of development sites as at April 2020 (31,452);
- new allocations resulting from this plan (10,704);
- delivery of small-scale sites of 3 or 5 homes enabled by Policy 7.5 of the GNLP (800);
- the expected supply of homes by windfall sites (1,296).
Annual delivery figures
To establish the annual delivery of housing in the vertical bars of the trajectory graph below:
- The most up to date evidence, the current five-year land supply figures, are used for delivery from 2020/2021 to 2024/2025;
- Beyond 2024/5, the undelivered commitment of 18,735 homes is spread evenly across the plan period at the rate of 1,441 dwellings per annum. Using an average delivery rate for the medium to longer-term of the plan period acknowledges the uncertainties about precise completion rates over the next 6 to 18 years;
- The next element of the housing trajectory anticipates when new allocations made by the GNLP are likely to be completed. Assuming adoption of the GNLP in 2022, a suitably cautious approach is to expect the first sites to begin building out in 2023/2024. The trajectory then incrementally accelerates the delivery of homes as sites come on stream until reaching an average rate of 792 homes per annum over the remainder of the plan period;
- The remaining smaller components of the housing trajectory are homes delivered through Policy 7.5 and the windfall allowance. In both instances the delivery of anticipated homes is averaged across the plan period. The difference between these two sources of supply is the likely start dates for delivery.
Annual targets
The horizontal lines on the graph show:
1. The whole plan average target per annum of 2,027. This does not take account of housing delivery in the first two years of the plan period, which was significantly above target.
2. The residual annual target of 1,961 per annum. This is the target for the remaining 18 years of the plan period, taking account of delivery between 2018 and 2020. This is the target which will be used to calculate 5-year land supply.
Trajectory Findings
The housing trajectory is considered a robust projection, especially in the short-term, for the submission of the plan. As time moves on and new evidence emerges, it will be possible to update average delivery rates with more precise projections through the examination of the plan. Updates will be informed by the plan’s monitoring framework, the annual five-year land supply and further engagement with development industry representatives.
Feedback from site promoters to date has shown that the majority are confident that their sites can start early and would therefore deliver more quickly than shown in the trajectory. However, given the uncertainty over the medium and longer term, an average is a better illustration of the potential to deliver.
The trajectory illustrates that potential delivery exceeds local housing need in every year.
Housing Trajectory
|
Summary Table |
Total Allocated Homes |
18/19 |
19/20 |
20/21 |
21/22 |
22/23 |
23/24 |
24/25 |
25/26 |
26/27 |
27/28 |
28/29 |
29/30 |
30/31 |
31/32 |
32/33 |
33/34 |
34/35 |
35/36 |
36/37 |
37/38 |
Total Delivery |
Homes Post 2038 |
|---|---|---|---|---|---|---|---|---|---|---|---|---|---|---|---|---|---|---|---|---|---|---|---|
|
Delivery 2018/2019 and 2019/20 |
5,240 |
2,936 |
2,304 |
|
|
|
|
|
|
|
|
|
|
|
|
|
|
|
|
|
|
5,240 |
0 |
|
Existing commitment |
31,452 |
|
|
1,987 |
2,609 |
3,349 |
2,621 |
2,161 |
1,442 |
1,442 |
1,441 |
1,440 |
1,440 |
1,440 |
1,440 |
1,440 |
1,440 |
1,440 |
1,440 |
1,440 |
1,440 |
31,452 |
0 |
|
New allocations |
10,704 |
|
|
|
|
|
200 |
400 |
600 |
792 |
792 |
792 |
792 |
792 |
792 |
792 |
792 |
792 |
792 |
792 |
792 |
10,704 |
0 |
|
Policy 7.5 delivery |
800 |
|
|
|
|
|
54 |
54 |
54 |
54 |
54 |
53 |
53 |
53 |
53 |
53 |
53 |
53 |
53 |
53 |
53 |
800 |
0 |
|
Windfall allowance |
1,296 |
|
|
|
|
|
|
|
100 |
100 |
100 |
100 |
100 |
100 |
100 |
100 |
100 |
99 |
99 |
99 |
99 |
1,296 |
0 |
|
|
|
|
|
|
|
|
|
|
|
|
|
|
|
|
|
|
|
|
|
|
|
49,492 |
