193
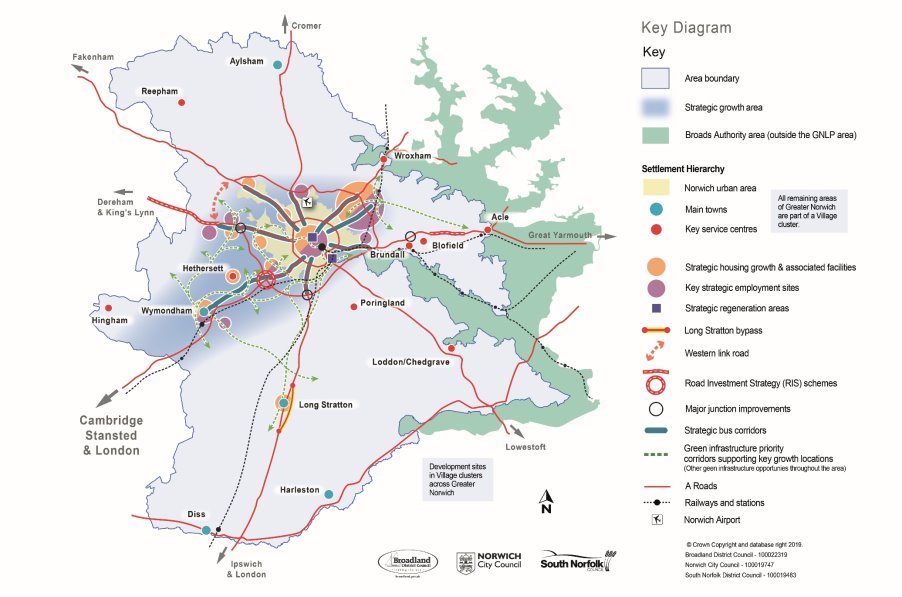
The strategy distributes around 74% of the growth in the “Strategic Growth Area”. This area is broadly defined on the Key Diagram and shown in map 7 to include:
- The main Cambridge Norwich Tech Corridor area, including Norwich, the North East Growth Triangle, the remainder of the Norwich Fringe, Hethersett and Wymondham;
- All the key strategic employment areas in the plan;
- All but one of the strategic scale housing growth locations (the exception is Long Stratton);
- High quality public transport, road and cycling infrastructure (both existing and planned) and
- The great majority of brownfield sites in the area.
194
Identifying this area promotes the strategic economic strengths and sectors of Greater Norwich. By linking to other regional growth corridors, it places Greater Norwich firmly on the national stage for growth and accessing external funding.
195
With Norwich playing an anchoring role in the strategic growth area, it also recognises the role the city plays as a driver of the regional economy, supporting the vitality and regeneration of the city centre, including maximising the potential of brownfield sites.
The Key Diagram
196
Strategic local plans are required to include a Key Diagram which illustrates key elements of the strategy in the plan on an indicative map.
Key Diagram
197
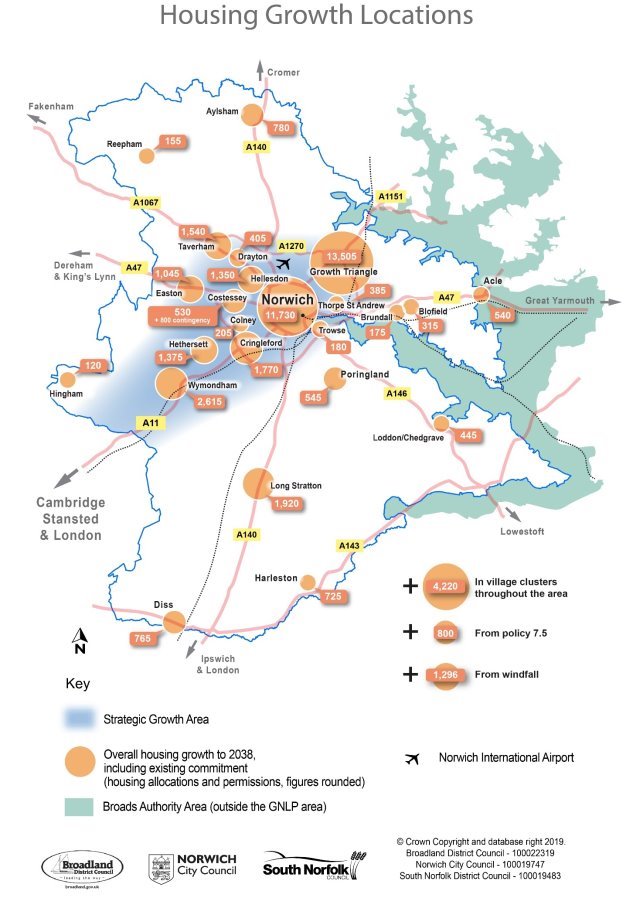
Map 7 below provides further detail for housing by illustrating the location and scale of housing growth allocated through the plan across Greater Norwich.
Map 7 Housing Growth Locations