MM1 - Paragraph 177
Page 47
Modification
Amend the final sentence of paragraph 177 to read:
This local housing need is the target plan requirement against which land supply will be measured (see appendix 64).
Reasons
To ensure the plan is justified and effective.
MM2 - Table 6
Page 48
Modification
Amend Table 6 to read:
Table 6 Establishing the Plan's total housing potential figure
|
Number of Homes |
Explanation |
||
|
A |
Local housing |
40,541 |
The minimum local housing need figure has been identified using the Government's standard methodology using 2014-based projections. This figure forms the housing requirement for the plan. |
|
B |
Delivery 2018/2019 |
|
The number of homes built in 2018/2019, |
|
C |
Existing commitment (at April |
34,668 |
The existing commitment is the undelivered sites which are already allocated and It includes forecast development from small sites of 9 or fewer homes and other windfall sites over the period 2023/24 to 2027/28. Delivery from allocated sites in this figure includes allocations made by this plan, the South Norfolk Village Clusters Housing Site Allocations Local Plan (1,200 dwellings) and the Diss and area Neighbourhood Plan (250 dwellings) and adopted development plan documents and area action plans. |
|
|
|
|
|
|
D |
Homes delivered through policy 7.5 |
|
Policy 7.5 provides for delivery of 3 |
|
E |
Windfall allowance |
|
There is a limited reliance on windfall sites. Evidence provides an estimated 4,450 homes resulting from windfall development during the remainder of the plan period. As windfall delivery is likely to remain robustly high it is appropriate to include a limited proportion as part of total potential delivery. |
|
F = B + C + D + E |
Total Forecast Supply |
|
The |
MM3 - Paragraph 179
Page 49
Modification
Amend paragraph 179 to read:
179. In line with the above figures, policy 1 provides for around 49,500 45,000 new homes. This is the total provision in the plan and is not the need or target requirement against which land supply will be measured (see appendix 64). The residual annual target for the 18 years of the remainder of the period, taking account of delivery between 2018 and 2020, is 40,541 (Row A) minus 5,240 (Row B), divided by 18 which equals 1,961 per annum.
Reasons
To ensure the plan is justified and effective.
MM4 - Paragraph 187
Page 49
Modification
Amend paragraph 187 to read:
187. A significant element of any further growth required in the next plan under the new planning system will be at a new settlement or settlements (see policy 7.6).
187. National policy requires reviews of local plans to be completed no later than five years from their adoption, meaning that a rolling programme of plan making takes place. It currently seems likely that there will be a need to plan for further growth through the next local plan.
Insert a new paragraph of text after existing paragraph 187 to read:
This plan identifies enough sustainable sites within and on the edge of settlements to meet currently assessed need for the plan period. A review of the local plan will need to assess options for longer term growth, including the potential for a sustainable new settlement or settlements.
A new settlement approach was considered in preparing this local plan but was rejected by the Partnership as being premature. The detailed exploratory work to consider options for a new settlement or settlements is intended to begin on adoption of this plan and will involve discussions with Government, agencies and partners along with public participation to inform the preparation of the next local plan.
Reasons
To ensure the plan is justified and effective.
MM5 - Table 7
Page 51
Modification
Amend Table 7 to read:
Table 7 Housing growth 2018 to 2038 (figures rounded)
|
Area |
Homes 2018 |
Homes 2038 (and increase) |
Increase % |
% of total housing growth |
|
Norwich urban area |
106,100 |
|
|
|
|
The Main Towns |
19,400 |
|
|
|
|
The Key Service Centres |
15,900 |
|
|
|
|
Village clusters |
46,100 |
|
|
9 |
|
Windfall + homes from policy 7.5 + small sites + forecast development from small sites of 9 or fewer homes |
NA |
|
NA |
|
|
Total |
187,500 |
|
|
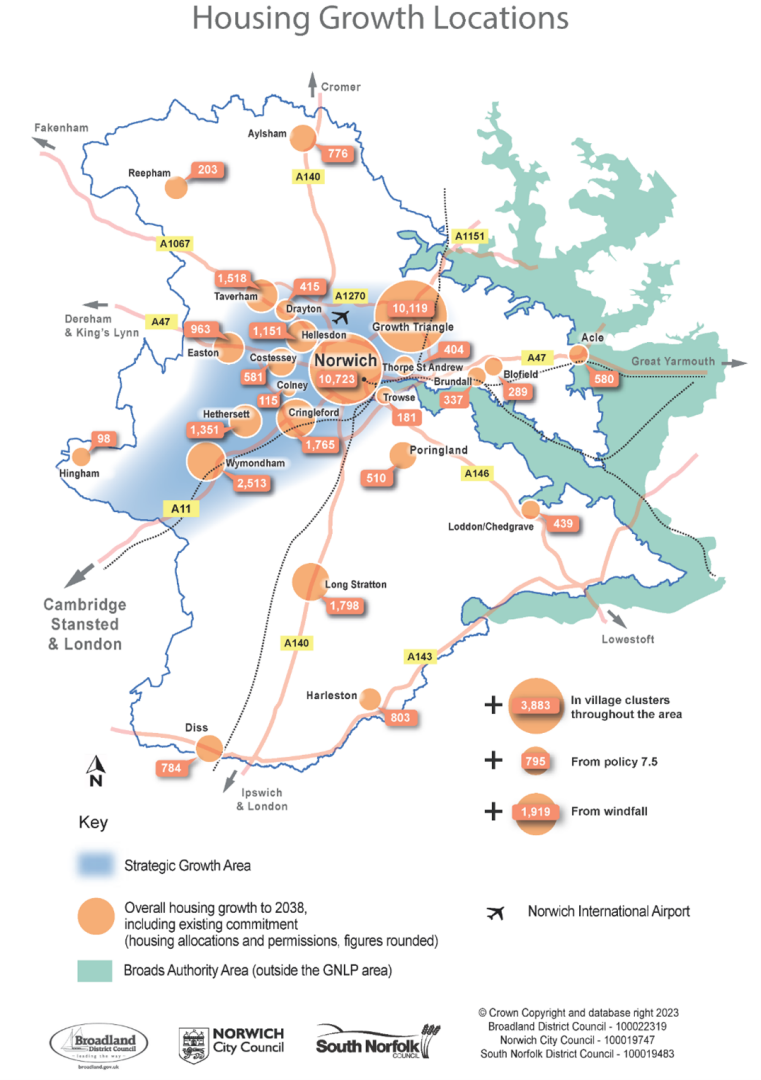
MM6 - Map 7
Page 54
Modification
Update Housing Growth Locations map to reflect changes in housing numbers:
Delete current map and insert new map as below:
Reasons
To ensure the plan is justified and effective
MM7 - Policy 1
Page 55
Modification
Amend Policy 1 to read:
POLICY 1 - THE SUSTAINABLE GROWTH STRATEGY (underlined in original)
Sustainable development and inclusive growth are supported by delivery of the following between 2018 and 2038:
toTo meet theneedrequirement for around 40,550 new homes, provision is made for a minimum of49,49245,041 new homes;.ToTo aid delivery of around 33,000 additional jobs and support key economic sectors, around 360 hectares of employment land is allocated, and employment opportunities are promoted at the local level;.supportingSupporting infrastructure will be provided in line with policies 2 and 4;.environmentalEnvironmental protection and enhancement measures including further improvements to the green infrastructure network will be delivered.
The sustainable growth strategy is illustrated in the Key Diagram.
SETTLEMENT HIERARCHY (underlined in original)
The settlement hierarchy is:
- Norwich urban area (Norwich and Norwich Fringe
65) (see glossary for definition). - Main towns.
- Key service centres.
- Village clusters.
Growth is distributed in line with the settlement hierarchy to provide good access to services, employment and infrastructure. It is provided through urban and rural regeneration, along with sustainable urban and village extensions.
Most of the housing, employment and infrastructure growth is focussed in the Strategic Growth Area illustrated on the Key Diagram. This includes Greater Norwich's part of the Cambridge Norwich Tech Corridor, including the Norwich urban area, Hethersett and Wymondham and key strategic jobs sites at Hethel and the Norwich Research Park. Growth is also focussed in towns and villages to support vibrant rural communities.
HOUSING (underlined in original)
Housing commitments are located to meet the need for homes across the area, providing good access to services, facilities and jobs, supporting sustainable urban and rural living. Accordingly, housing commitments are distributed as follows:
|
Area |
Existing |
Homes forecast to be delivered from allocated sites by March 2038 |
Total 2018 - 2038 |
||
|
Norwich urban area |
|
|
|
||
|
The main towns of Wymondham, Aylsham, Diss (with part of Roydon), Harleston and Long Stratton |
5,035 |
|
6,674 |
||
|
The key service centres of Acle, Blofield, Brundall, Hethersett, Hingham, Loddon / Chedgrave, Poringland / Framingham Earl, Reepham and Wroxham |
3,137 |
675 |
3,812 |
||
|
Village clusters
|
In the remaining parts of Broadland (see policy 7.4 and the GNLP Sites Plan for specific sites) |
1,054 |
442 |
3,883 |
|
|
In South Norfolk (see policy 7.4 and the South Norfolk Village Clusters Housing Site Allocations Local Plan for specific allocations) |
1,187 |
A minimum of 1,200 |
|||
|
Forecast development from small sites of 9 or fewer homes and other windfall sites over the period 2023/24 to 2027/28 |
1,089 |
N/A |
1,089 |
||
|
Allocations Total |
|
|
|
||
|
Homes delivered though policy 7.5 |
NA |
795 |
|||
|
Windfall allowance for the period 2028/29 to 2037/38 |
NA |
830 |
|||
|
Overall Total |
45,041 |
||||
Policies 7.1 to 7.5 provide details on distribution and the Sites document provides individual site policies. Individual site policies for villages in South Norfolk will be in the South Norfolk Village Clusters Housing Site Allocations Local Plan.
To provide choice and aid delivery of housing, proposals for additional "windfall" housing growth will be considered acceptable in principle at appropriate scales and locations where they would not have a negative impact on the character and scale of the settlement, and subject to other local plan policies:
- Within settlement boundaries in accordance with the above settlement hierarchy
;.
- Elsewhere in village clusters, subject to the requirements of policy 7.4.
- On sites of up to 3
to 5self or custom build dwellingsin all parishes,subject to the requirements of policy 7.5.
Plan review and five-year housing land supply (underlined in original)
This plan will be reviewed in line with the requirements on the new plan-making system. Five-year housing land supply will be calculated across the whole of the three districts. TheAppendix 4 shows that the plan provides enough allocations to provide a five-year housing land supply on adoption66.
ECONOMY (underlined in original)
Key Strategic employment locations in the Key Diagram are protected from other forms of development and will support both a broad range of employment and key economic sectors as set out in policy 6. The key strategic locations are:
- Norwich
city centre;City Centre. - the Norwich Airport area
;. - Browick Interchange, Wymondham
;. - Longwater
;. - Rackheath
;. - Broadland Business Park
;. - Broadland Gate
;. - Norwich Research Park
;. - Hethel and
- The Food Enterprise Park at Easton/Honingham.
In addition, smaller scale employment sites are allocated in urban areas, towns and large villages to provide local job opportunities, supporting small businesses and vibrant urban and rural economies.
INFRASTRUCTURE (underlined in original)
The sustainable growth strategy will be supported by improvements to the transport system, green infrastructure and services as set out in policies 2, 3 and 4.
Reasons
To ensure the plan is justified and effective.