37
The estimated total population7 of the three districts in 2018 was 409,000. Of this, 55% of the population live in the Norwich urban area8, with around 10% living in the market towns of Aylsham, Diss, Long Stratton, Harleston and Wymondham. Around 35% of the population live in smaller towns and villages.
38
Parishes close to the city have a strong relationship with Norwich, while parts of the area look to the network of towns and larger villages to meet every day needs and provide employment
Table 1 - Population of the largest settlements in Greater Norwich, 2011
|
Settlement |
Population 2011 census9 |
|---|---|
|
Norwich urban area |
213,166 |
|
Wymondham |
14,405 |
|
Diss |
7,572 |
|
Aylsham |
6,016 |
|
Hethersett |
5,691 |
|
Poringland (including Framingham Earl) |
4,826 |
|
Harleston |
4,641 |
|
Long Stratton |
4,425 |
|
Horsford |
4,163 |
|
Brundall |
4,019 |
|
Blofield |
3,316 |
|
Acle |
2,824 |
|
Reepham |
2,709 |
|
Hingham |
2,367 |
|
Loddon and Chedgrave |
2,284 |
|
Wroxham |
1,502 |
39
Long term trends underpin the need for the GNLP to plan for continued population growth. The numbers of people living in Greater Norwich rose steadily from 351,000 in 2001 to 381,000 in 201110. This was due to both natural increase, such as people living longer, and people moving into the area, largely from elsewhere in the United Kingdom.
40
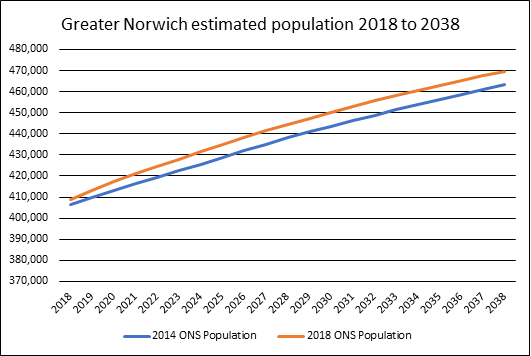
Estimates shown in the graph below are based on the 2014 and 2018-based population projections. These suggest that increases will continue in the years up to 2038, with the population rising to between 463,000 and 470,000 by 203811. Our housing need calculation is derived from the standard methodology and its requirement to base it on 2014 based projections, and our targets reflect this, but we recognise the 2018-based projections are different and we have a plan with the flexibility to provide for this additional growth.
Greater Norwich estimated population 2018 to 2038
The population mix
41
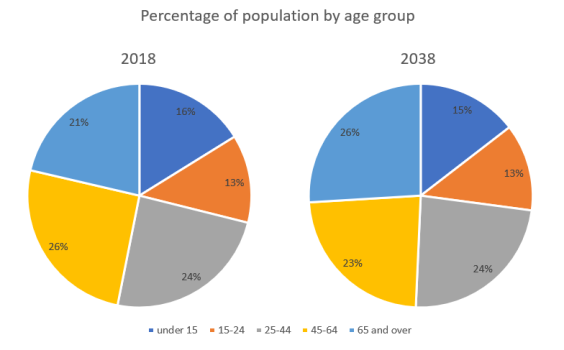
The population of Greater Norwich has relatively high proportions of older people compared to national figures and this pattern is set to increase to 2038 as shown in the charts below12. Broadland and South Norfolk have proportions of older people significantly above the national average. Further growth of the older population will add to already significant pressure on residential and home care services, so it is important that the GNLP plans for changing housing needs.
42
Birth rates have declined in recent years, both locally and nationally. The birth rate in Greater Norwich fell from 11.3 in 2011 to 9.6 in 201813 reflecting the national pattern. The birth rate in England and Wales in 2018 was the lowest ever recorded.
44
While the overall proportion of minority ethnic residents is relatively low, there was a significant increase from 1.8% in the Greater Norwich area in 2001 to 4.8% in 2011. This increase is particularly relevant to Norwich, which saw an increase from 3.2% in 2001 to 9.3% in 2011.
Footnotes
7ONS 2018 based sub-national population projections
8The Norwich Urban area is Norwich and the built-up parts of the fringe parishes of Colney, Costessey, Cringleford, Drayton, Easton, Hellesdon, Old Catton, Sprowston, Taverham, Thorpe St. Andrew, Trowse and the remainder of the Growth Triangle.
9ONS census 2011 from https://www.nomisweb.co.uk/reports/localarea
10Census data as above
12ONS 2014 based and ONS 2018-based sub-national population projections
12Source ONS 2018 projections
13Source ONS – the birth rate is the number of live births per year per thousand people